.svg)

.png)


“So what does location awareness have to do with schedules? How can we use this information to alter the outcomes our projects?”
Part 3: How integrating the schedule can tie it all together
Visualizing productivity is a fascinating new feature that can provide your field leaders with information they’ve never had before. But we want to guarantee Kwant makes lives easier- not adding time to analyze productivity metrics to their busy, ever-changing days.
Kwant can be a one-stop shop for progress tracking, too. In Parts 1 & 2, we focused on zone-based analysis without considering the percentage of task completion.
But when we add material tracking and task completion to the information we collect, we can study the productivity achieved in the actual project, directly compared with the anticipated results.
Here’s how we do it:
Select a task on the project’s schedule, and assign the following parameters to it.
- Cost Code
- Location of task
- Company to complete task

Using the steps we discussed in Part Two of the Location Awareness Series, we can link these specific zones & workforce assignments, so we can automatedly document the actual hours being spent on the task- or if no hours have been spent at all!
You can see why this information can have a serious impact on the project: it gives field leaders and project managers eyes on areas they couldn’t see before.
- If no one is working on a Critical Path task, that miscommunication can be addressed immediately.
- If only half the labor planned is on the site, those tasks will be affected, and the inconsistency in hours is highlighted.
These items affect if the work is being completed on time. Here’s how your team can use Kwant to track work completed.
There are 3 methods to assign the percentage of work completed. Kwant will help you determine which is best for your team and functions. Many companies find that field leaders can incorporate this into their existing site walkthroughs, and access Kwant on a smartphone, or iPad.
The first method is to use the slider on the top of the Task Page (image right).
The second is to update the actual material being consumed in comparison to the budgeted material on the schedule
(image left).
The second is to update the actual material being consumed in comparison to the budgeted material on the schedule.
And thrid, you can integrate a Buiding Information Model with your schedule, and update it on an element or task basis. You can read more about BIM integration on our platform using the following link:
With these updates, we can visualize the Work in Progress status of each cost code.
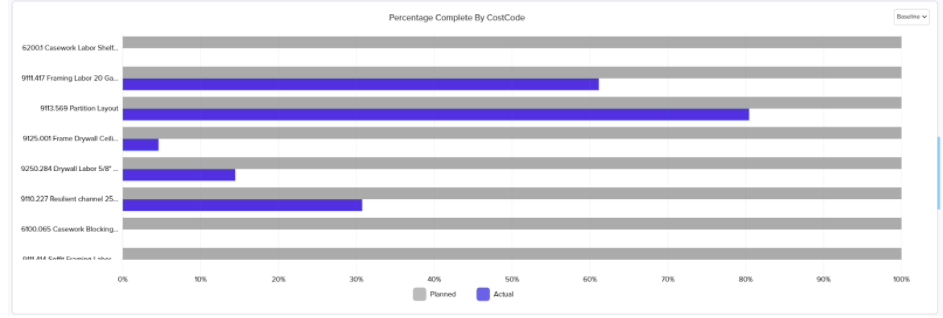
For the members of your teams engaged in more detailed analyses of the project progression, the daily tracking dashboard allows you to conduct an earned value analysis by generating traditional performance indexes such as Schedule Performance Index and Cost Performance Index.
The risk man-hours column helps to understand if there is an opportunity to increase the earned value or if we’re trending toward spending more hours than assigned. Now we know if concrete action needs to be taken.
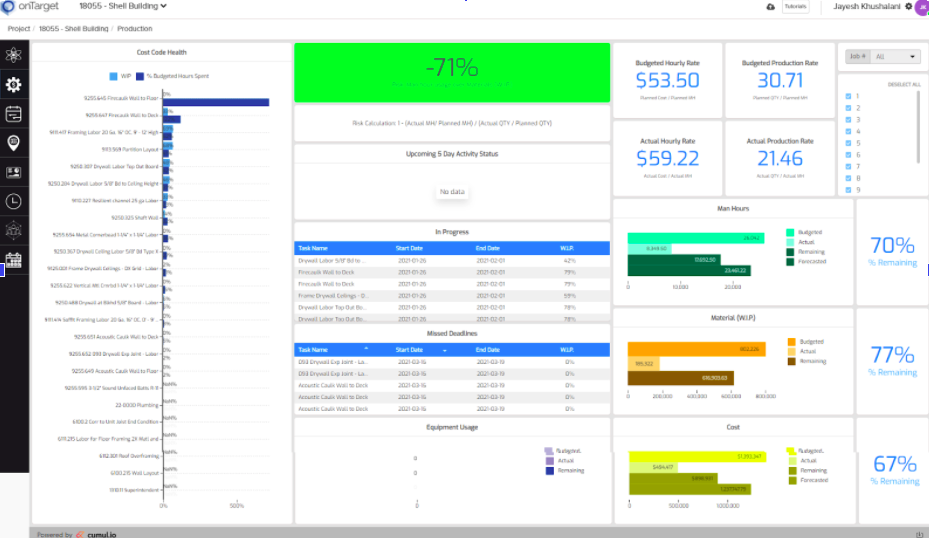
The Production Rate Graph (shown below) is another visual tool that helps in gauging the planned production rate vs actual production rate, document material being consumed, and actual hours spent on a task on a particular day.
Want the info, but don’t have time to check this specific dashboard?
No worries: the overarching information is embedded into the production dashboard, which provide an overview of the entire project- customized with filters that help to break down the information into the data you actually need- be that location, cost code, task, etc.
The project-level summary is also included in daily or weekly emails to those project members who need to keep tab of active activities. Identities of individual workers can be hidden as well, only provided to the safety manager to mitigate any dangerous situations.
Because the workers are already equipped with badges, we’re able to use the platform to improve emergency response times. How? Each badge includes an SOS alert button that activates when double-tapped.
This prompts a notification sent to field leaders, medics, or other relevant personnel in the event of an accident. Fall detection also automatically sends an alert. This message includes vital information, such as the worker’s location, trade, and mobile number.
It can also benefit reporting efforts after the urgency is addressed, by documenting the time and date of the event.
Thanks to the productivity analysis & location awareness your team now has access to, Kwant is helping companies manage projects with ease, and filling in the gaps to increase earning potential and see success on a project. Your workers are safer, processes quicker, and lives easier than they could be before.


%20(1).svg)


