.svg)

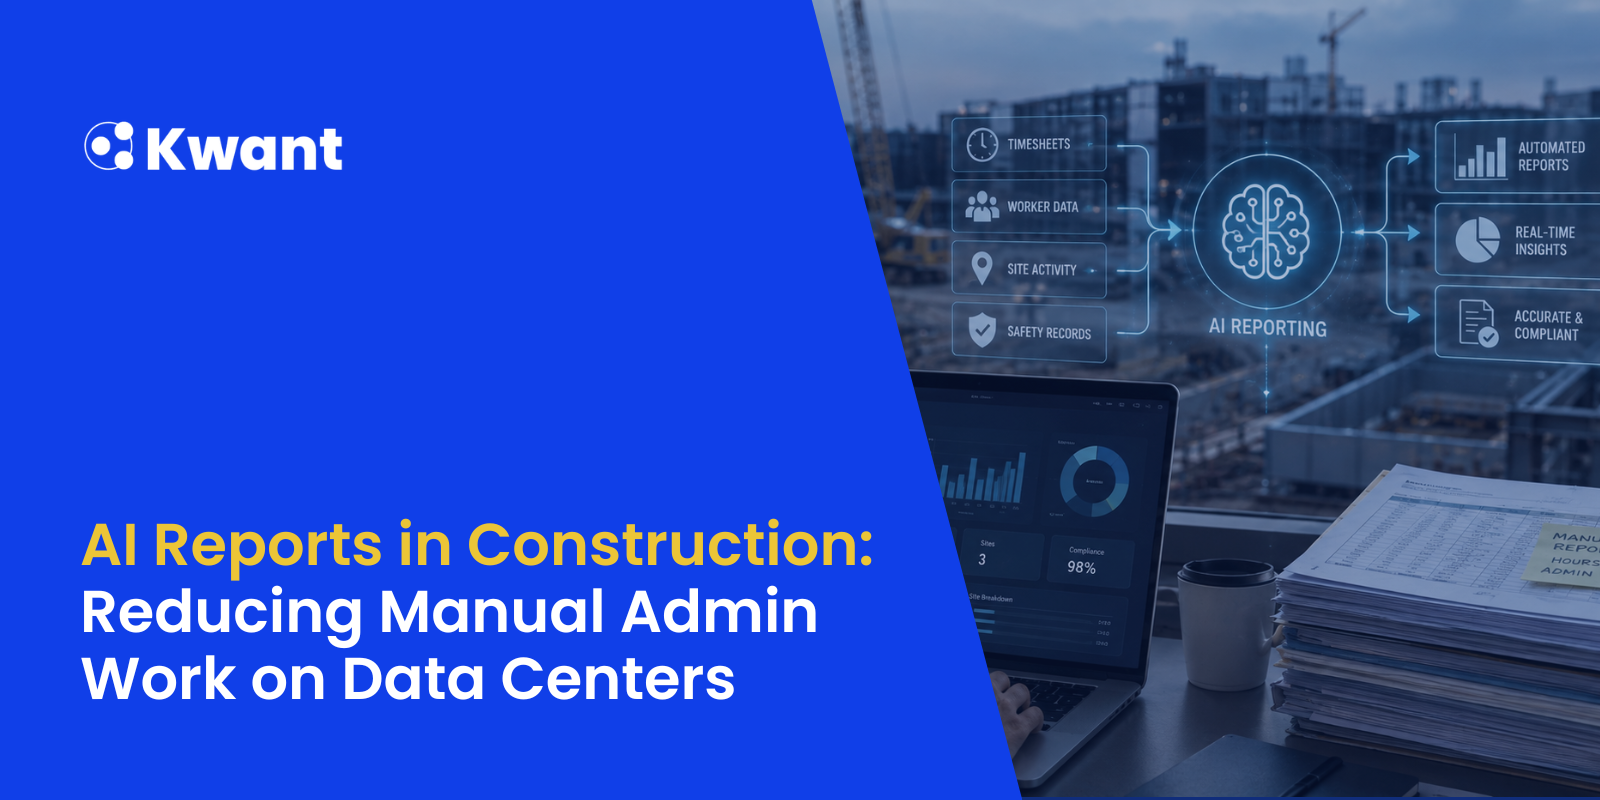


In 2026, AI reporting for construction is helping data center teams reduce the manual work involved in workforce and project reporting by automatically collecting and organizing data from connected systems such as smart badges, access control turnstiles, and IoT sensors. Instead of relying on spreadsheets, manual headcounts, and end-of-day updates, teams can use continuously updated dashboards to monitor workforce levels, contractor attendance, labor distribution, safety compliance, productivity, and site activity in real time. AI-powered workforce analytics can also identify trends such as labor shortages, trade congestion, overtime increases, and changing workforce distribution before they become larger operational issues. Natural-language tools such as Kwant's Bob AI Assistant allow teams to query workforce data without manually building reports, while role-based dashboards provide executives, project controls teams, safety managers, and operations teams with the information most relevant to their responsibilities.
Overview:
Every large data center project generates an enormous amount of information.
Thousands of workers badge in and out each day. Contractors change by the hour. Safety meetings happen before every shift. Productivity fluctuates between trades, buildings, and work packages. Project controls teams constantly need updates, while executives expect accurate reports that reflect what's happening on site and not what happened yesterday.
Yet many teams still spend hours every day assembling reports manually.
Project engineers export spreadsheets. Safety managers collect attendance records. Superintendents text updates from the field. Administrators copy information between systems before anyone can actually analyze it.
By the time leadership receives the report, the project has already moved on.
As AI becomes part of everyday construction operations. One of its most practical applications isn't replacing people, but the capability to eliminate repetitive administrative work so teams can spend more time managing projects instead of documenting them.
Why Reporting Is Different on Data Center Projects
Data centers operate at a pace few other construction sectors experience.
Multiple buildings progress simultaneously. Hundreds of subcontractors often work side by side. Mechanical, electrical, commissioning, and structural activities overlap instead of occurring in clean phases.
This creates a reporting challenge.
Project owners want real-time visibility into workforce numbers, schedule progress, and contractor performance. General contractors need operational insight to coordinate work safely and efficiently. Project controls teams need reliable data to compare actual performance against planned schedules.
Unlike smaller commercial projects, reporting isn't simply about documenting progress. It becomes an operational tool for making decisions throughout the day.
Common reporting requirements include:
- Daily workforce counts
- Contractor attendance
- Trade distribution
- Labor hours
- Shift activity
- Site access records
- Safety compliance
- Productivity trends
- Area occupancy
- Schedule performance
- Executive dashboards
Each of these reports often depends on data collected from multiple disconnected systems.
The more people involved, the more time reporting will consume.
The Cost of Manual Reporting
Manual reporting isn't simply inefficient. It introduces delays that affect decisions across the project.
Decisions Based on Yesterday's Information
If workforce reports are created every evening, leadership starts the next day using outdated information.
- Unexpected labor shortages.
- Trade congestion.
- Missing crews.
- Unexpected overtime.
These issues often aren't discovered until someone manually notices them.
Administrative Bottlenecks
Project engineers and administrators frequently become report builders instead of project managers.
Hours that could be spent coordinating work are instead dedicated to:
- Cleaning spreadsheets
- Matching contractor lists
- Updating dashboards
- Verifying headcounts
- Combining multiple exports
- Correcting duplicate records
As projects grow, reporting scales almost linearly with workforce size.
Inconsistent Data
Different departments often maintain different versions of the truth.
Safety reports show one workforce number.
Project controls report another.
Access control reports something different again.
Instead of discussing project performance, meetings become discussions about which spreadsheet is correct.
What AI Reporting for Construction Actually Changes
AI doesn't improve reporting simply because it generates charts.
Its value comes from removing the manual work between collecting information and delivering insights.
The foundation is how data enters the system. On modern data center projects, workforce information flows automatically from connected hardware like smart badges, turnstiles, and IoT sensors deployed across the site, into a centralized real-time location system. Workers don't need to fill out forms every time and supervisors don't need to compile attendance sheets manually for different access points. The platform continuously reads location, access, and movement data and updates dashboards as conditions change.
That changes reporting from a daily task into a live operational system.
Rather than asking someone to build a report every morning, project teams simply open a dashboard that is already current.
The result is faster decision-making with significantly less administrative effort.
Turning Workforce Data Into Operational Intelligence
Collecting workforce information is only the first step. The real value comes from understanding what the data means.
AI can identify patterns that are difficult to spot through manual reporting. Tools like Kwant's Bob AI Assistant allow project teams to query workforce data in a natural language. For example, asking questions like "How many workers from Subcontractor X are on site right now?" or "Which buildings are understaffed compared to plan?" and receive immediate answers without pulling a single jobsite report manually. Instead of a project engineer spending an hour cross-referencing contractor lists, the answer is available in seconds.
Beyond such on-demand querying, AI-powered predictive analytics can easily identify patterns that are difficult to spot with manual reporting:
- Workforce levels consistently lower than planned
- Trades arriving earlier than scheduled
- Overtime increasing week after week
- Labor distribution shifting between buildings
- Contractor productivity changing over time
- Areas becoming overcrowded during specific shifts
Instead of searching through spreadsheets, project teams receive insights automatically. This helps supervisors focus on solving operational problems instead of discovering them. The same data that once required hours of manual analysis becomes immediately actionable.
Reporting That Supports Every Level of the Project
Different stakeholders need different answers.
- Executives care about overall project performance.
- Project controls teams need schedule alignment.
- Safety managers monitor workforce compliance.
- Superintendents focus on daily execution.
Modern AI reporting allows each group to access the information relevant to their responsibilities without creating separate reports for every audience.
Thus, instead of creating four separate reports, one connected reporting system will build on a unified workforce operating system that can serve everyone.
What Leading Data Center Teams Are Doing Differently
The most advanced construction organizations no longer treat reporting as an administrative requirement. They view reporting as an operational capability.
Leading teams invest in connected workforce data that updates automatically throughout the day.
Rather than relying solely on end-of-day summaries, they monitor project activity continuously, allowing them to react before small issues become schedule delays.
This approach is already proven at scale. Kwant's workforce management platform for data center builders supports four of the largest U.S. data center builders; organizations managing complex, multi-building programs where manual reporting would be impossible to sustain at the speed these projects demand. See the data center case study
AI also makes historical reporting more valuable.
Instead of simply archiving reports, organizations can compare workforce performance across projects, identify recurring bottlenecks, and improve forecasting for future builds. Portfolio analytics extends this to enterprise programs, giving owners and project managers a single view across multiple active sites rather than waiting for consolidated reports from individual project teams.
This shift transforms reporting from documentation into decision support.
As AI adoption grows across construction, organizations that automate reporting today will have a significant advantage in planning tomorrow's projects.
What to Look for in an AI Reporting Platform
Not every reporting solution delivers meaningful operational value.
When evaluating AI reporting for construction, look for capabilities that reduce manual work while improving data quality.
A strong platform should provide:
- Automatic workforce data collection:Drawing from connected hardware (smart badges, turnstiles, IoT sensors) rather than manual input
- Real-time construction reporting: Dashboards that update continuously, not at end-of-day
- Workforce dashboards that update continuously: System that does not need repetitive report submissions
- Natural language workforce querying: The ability to ask questions in plain language and receive immediate answers, as Kwant's Bob AI Assistant enables
- Contractor-level performance visibility: Specific reporting by subcontractor, trade, and work zone
- Historical trend analysis: The ability to compare current performance against past projects
- Custom executive dashboards: Role-appropriate views for different stakeholders without building separate reports
- Integration with existing workforce and access management systems: So reporting doesn't require a separate data-entry process
- AI-driven workforce analytics that identify emerging issues instead of simply displaying data
- Secure data governance with role-based access and audit-ready records
The goal isn't simply to generate more reports. It's to make reporting almost invisible by embedding it into everyday project operations.
Construction teams don't struggle because they lack data. They struggle because too much time is spent organizing it.
Manual reporting slows decision-making, consumes valuable project resources, and makes it harder to identify problems before they impact schedule or productivity.
AI changes that equation by transforming workforce information into continuously updated operational intelligence. Instead of spending hours building reports, teams can spend those hours managing projects, supporting crews, and keeping complex data center construction moving forward.
See How Kwant Approaches AI Reporting
Kwant helps general contractors, owners, and project teams automate workforce reporting with real-time visibility into labor, compliance, productivity, and site activity. Instead of manually assembling spreadsheets, teams gain live dashboards and AI-powered insights that support faster decisions across every phase of a data center project.
Explore Kwant's mission-critical construction platform or request a demo to see how automated workforce reporting can reduce administrative work while improving project visibility.
Frequently Asked Questions: AI Reporting for Construction
What is AI reporting for construction?
AI reporting for construction uses artificial intelligence to automatically collect, organize, and analyze project data, reducing the need for manual spreadsheet work. Instead of waiting for end-of-day reports, teams can access real-time information on workforce activity, productivity, and compliance through continuously updated dashboards. Platforms like Kwant go further by enabling natural language querying through tools like the Bob AI Assistant, so anyone on the project team can pull the data they need without relying on a report builder.
How does automated data center workforce reporting reduce administrative work?
Automated reporting gathers workforce information from connected systems like smart badges, access control turnstiles, and IoT sensors, eliminating repetitive tasks such as exporting spreadsheets, reconciling contractor lists, and manually updating dashboards. This allows project teams to spend more time managing operations and less time preparing reports.
What types of reports can AI generate on a data center project?
AI can support daily workforce reports, labor hour summaries, contractor attendance, productivity trends, compliance tracking, schedule comparisons, executive dashboards, and historical performance analysis. For multi-site programs, portfolio analytics consolidate all of this into a single enterprise view across active projects. The exact reports depend on the data sources available and the organization's reporting requirements.
Can AI-driven workforce analytics improve project productivity?
Yes. AI-driven workforce analytics help identify trends such as labor shortages, trade congestion, overtime increases, or uneven workforce distribution. By surfacing these insights quickly, teams can make informed decisions before small issues become larger schedule or productivity challenges.
How is real-time construction reporting different from traditional reporting?
Traditional reporting is typically prepared manually at set intervals, often using information that's already outdated. Real-time construction reporting updates continuously as new workforce data is collected, giving project teams a current view of site conditions and enabling faster operational decisions. This also supports the OSHA recordkeeping compliance, which requires accurate and timely documentation of workforce activity and safety training.
What should contractors look for in an AI reporting platform?
Contractors should prioritize platforms that automate data collection, provide customizable dashboards, integrate with existing workforce and access management systems, support AI-driven workforce analytics, and present information in a way that's easy for executives, project controls, and field teams to use. The best solutions reduce manual effort while improving confidence in the data being reported.

.png)
%20(1).svg)


