.svg)


Ask a superintendent how productive the crews were last week, and you'll get an answer. It will be confident, specific, and based on a combination of direct observation, daily reports, and professional experience. It will also be incomplete, not because the superintendent isn't competent, but because no human being can simultaneously observe hundreds of workers across a multi-acre site. It is not possible for a person to track what each of the workers was doing with their time across a large construction site.
The research on construction labor productivity suggests that the gap between what superintendents believe about workforce productivity and what the data actually shows is significant. Studies from independent research organizations consistently find that direct productive work accounts for well under half of average construction labor time. The rest is distributed across waiting, travelling, handling materials, and activities that support but don't directly advance the work. This is not a new finding. It has been a known feature of the industry's productivity landscape for decades.
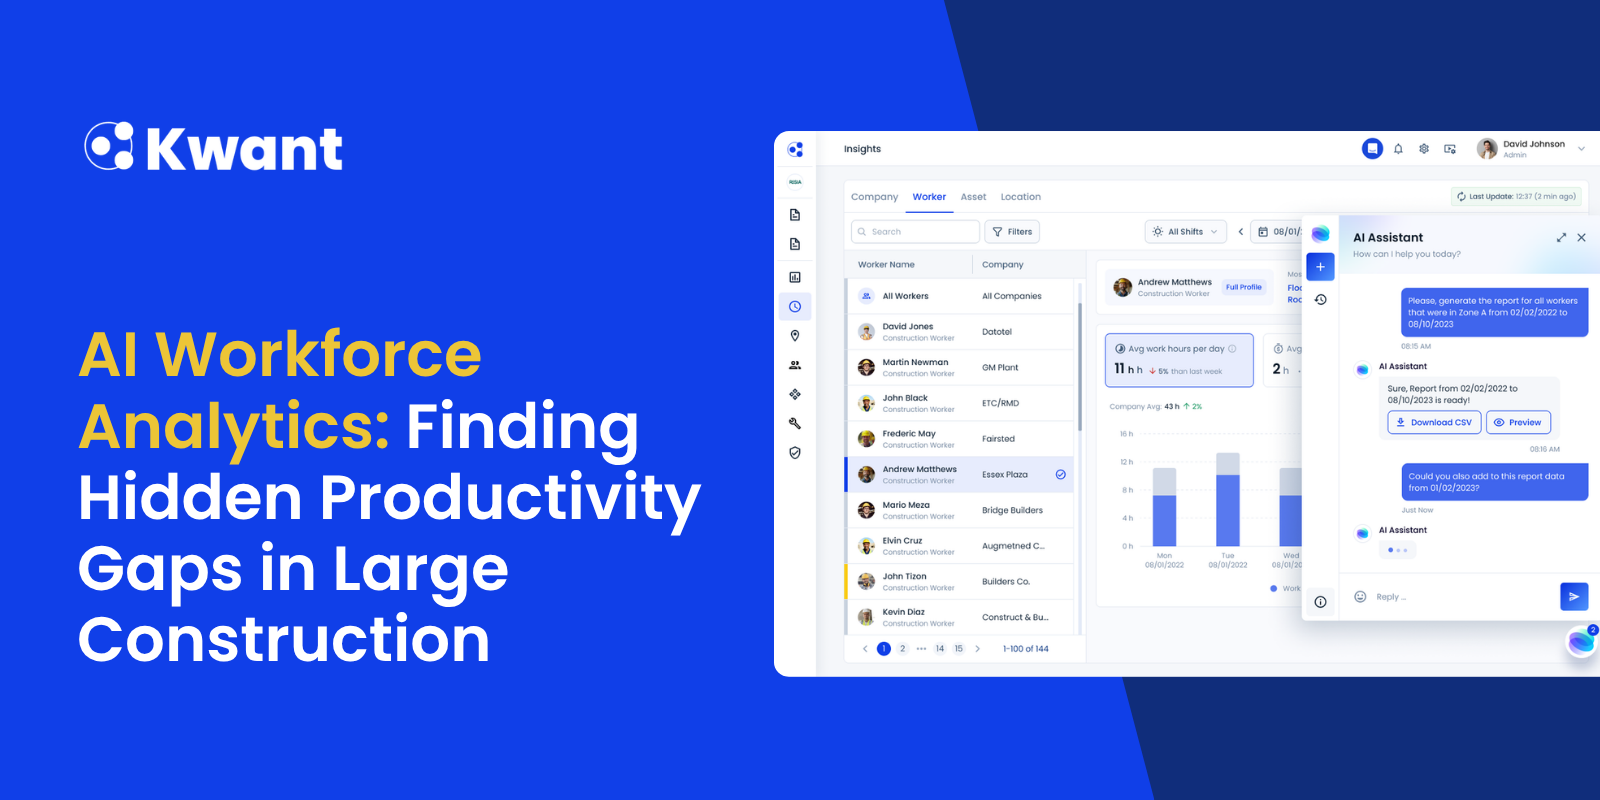
What is new, is the ability to see it. AI workforce analytics connects the data that already exists on most construction sites - access control records, time logs, field productivity reports - and applies pattern recognition that identifies where the hidden losses are coming from, which crews and work packages they are concentrated in, and what the trends look like over time. The losses don't go away automatically when they become visible. But they cannot be systematically addressed until they are.
Why Large Construction Sites Have a Specific Productivity Problem
Productivity losses on large construction sites are not distributed evenly. They concentrate in specific conditions: transition periods when one trade is completing and another is beginning; high-density zones where multiple trades are working simultaneously in constrained space; the first and last hours of each shift, where mobilization and demobilization overhead accumulates; and work packages with complex material logistics where waiting for materials to arrive at the work face is a consistent pattern.
On a small site with a single superintendent who knows every worker, these patterns are visible through direct observation. They are discussed at the morning standup, addressed in the afternoon, and tracked informally against the weekly plan. The feedback loop is fast because the observation network is comprehensive.
Large sites break this model. With four hundred workers across a campus, no individual has comprehensive visibility. The morning standup covers the major areas, but the subtle patterns; the crew that consistently accumulates twenty minutes of non-productive time around the midday break, the material delivery sequence that reliably creates idle time for three trades every Tuesday morning. These actions are invisible at the organization level even when they are dimly visible to the foremen experiencing them.
Kwant’s Time & Attendance Daily Reporting solves the manual effort and incompetent counting errors. Kwant’s construction daily reports helps contractors get accurate morning headcounts, track worker fatigue and overtime, and export timesheets automatically. Using real-time data collected from your hardware to make smarter project decisions.
What Construction Workforce Analytics Actually Measures
Construction workforce analytics is not surveillance. It is the aggregation of data that is either already being collected or can be collected with minimal additional overhead, organized in a way that reveals patterns at the site and program level rather than just the individual crew level.
The data inputs that drive the most useful analytics are:
- gate-to-gate access records (when workers enter and exit the site, and through which gates, which gives a baseline measure of time on site),
- work package assignment records from field reporting tools (which connect the time-on-site data to specific activities), and
- productivity field reports from foremen (which provide the installed quantity or progress data that contextualizes the labor hours).
From these inputs, several derived metrics become calculable that are not available from any single source: wrench time ratio (the proportion of gate-to-gate time spent in direct productive activity), crew efficiency index (actual productivity per labor hour compared to the plan estimate for the same activity), and variance from staffing plan (the daily gap between committed and actual crew size by trade and work package).
AI adds the pattern recognition layer. Rather than requiring a project controls analyst to identify patterns by manually reviewing the data. The AI component continuously scans for anomalies, trends, and correlations, flagging the crew that has shown declining efficiency for four consecutive days, the work package where labor hours are accumulating faster than installed progress, and the contractor whose headcount delivery against commitments has trended downward over three weeks.
The Productivity Gaps That AI Analytics Consistently Surfaces
On large construction sites, AI workforce analytics tends to surface the same categories of hidden loss repeatedly. Understanding what to look for helps project teams interpret the outputs and direct attention to the right investigations.
- Gate-to-gate time inflation is one of the most consistent findings. Workers who are on site for nine hours but whose direct productive time is estimated at four to five hours are accumulating travel, waiting, and administrative time that is proportionally high. Gate-to-gate analytics identifies which crews and which zones show the largest gap, directing investigation toward the specific causes. Whether that is poor material staging, inadequate supervision coverage, or legitimate transit time that the site layout makes unavoidable.
- Trade sequencing conflicts show up as density anomalies in zone-level access data. When two or three trades are simultaneously concentrated in the same zone at a higher density than the area plan calls for, it typically indicates that work is not progressing in the planned sequence - one trade is waiting for another to complete, or competing for workspace in a constrained area. These conflicts are among the most expensive productivity losses because they create idle time for multiple trades simultaneously.
- Contractor headcount delivery gaps are perhaps the most directly actionable output. The difference between a subcontractor's committed crew size and their actual delivered crew, tracked daily over weeks, produces an objective performance record that changes conversations with underperforming contractors from opinion-based to data-driven.
From Analytics to Action: What the Response Workflow Looks Like
Workforce analytics produces value only when it is connected to a management action. The most effective programs have a defined response workflow for the alert categories the platform generates:
- When a headcount variance alert fires - actual crew 15% or more below plan on a critical path work package - the response is a same-day conversation with the responsible subcontractor superintendent. Not a weekly meeting agenda item. A same-day call, with the data as the starting point, focused on understanding the cause and confirming the timeline for return to full crew.
- When an efficiency decline alert fires - a crew's productivity rate has dropped below plan for three or more consecutive days - the response is a focused field observation in the affected area. The data identifies the pattern. The field observation identifies the cause. The intervention follows the cause, not the symptom.
- When a zone density anomaly is flagged - an area is showing workforce concentration inconsistent with the area plan - the response is a coordination review with the area superintendent to determine whether a sequencing conflict is developing and whether trade sequencing needs to be adjusted before idle time accumulates.
The response workflow should be documented and owned by named individuals at the project level. Analytics that generates alerts without a named owner and a defined response timeline is a reporting tool, not a management tool.
Generate Actionable Reports in Minutes with Kwant AI Assistant
What Leading GCs Are Doing With Workforce Data That Others Are Not
The GCs who have moved furthest in applying AI workforce analytics are not primarily using it for internal performance management. They are using it as a competitive capability in owner relationships.
Owner reporting that includes workforce performance data - daily headcount vs. plan by work package, contractor delivery trends, productivity index by trade - communicates a level of program management sophistication that distinguishes these GCs from competitors who provide narrative progress updates and weekly schedule summaries. Owners who manage large capital programs can see the difference between a GC who is actively managing their workforce and one who is managing their reporting about the workforce.
The forward-looking application is program-level intelligence. GCs managing multiple concurrent projects for the same owner can use workforce analytics to identify which sites are tracking well, which are showing early warning signs of schedule risk, and how to allocate management attention and resources across the portfolio. This kind of program-level view is only possible when workforce data is consistent and aggregated across sites - which requires a platform, not a collection of site-level tools.
Selecting a Workforce Analytics Platform: What Actually Matters
- Native data integration with access control and time-and-attendance systems. The analytics layer is only as good as the data it receives. A platform that requires manual data entry or batch file uploads introduces the latency and inconsistency that undermines real-time usefulness.
- Work-package-level visibility, not just site-level aggregation. Site-level productivity summaries are useful for owner reporting. Project controls requires work-package-level detail - where the efficiency gap is, not just that one exists.
- Anomaly detection with alert ownership, not just dashboards. Dashboards that show performance metrics are information systems. Management tools assign alerts to owners and track resolution. Evaluate whether the platform closes the loop.
- Mobile-first design for field users. Foremen and superintendents who are the primary data entry points for productivity reports need interfaces that work on a phone in the field, not a desktop in the trailer.
- Contractor-level performance tracking with historical context. The most useful analytics output for subcontractor management is the longitudinal performance record - how this contractor's headcount delivery and productivity have trended over the life of the project, not just last week's variance.
The productivity losses that AI workforce analytics surfaces are not new. They have been present on every large construction project, accumulating quietly in the gap between planned performance and actual performance, absorbed into contingency or schedule float until there is not enough of either left to absorb them.
What is new is the ability to see them early enough to do something about them. The patterns that used to surface in a week-twelve schedule conversation are now visible in the data by week four. The contractor performance gap that used to require a difficult conversation with three weeks of anecdotal evidence can now be addressed in week two with ten days of clean data.
That shift in timing is where the real value lives. Not in the analytics platform itself, but in the window of response it opens - and what an experienced project team does with that window.
See how Kwant's AI workforce analytics surfaces productivity gaps and supports schedule performance on large construction programs. Request a demo at kwant.ai.
Frequently Asked Questions
What is construction workforce analytics and how does it differ from standard labor reporting?
Construction workforce analytics is the continuous collection and pattern analysis of workforce performance data - headcount, time utilization, productivity measurements, plan adherence - to generate actionable insights about where labor performance is below expectations and why. Standard labor reporting produces periodic summaries of past performance. Workforce analytics produces continuous signals about current performance trends, with anomaly detection that flags problems before they accumulate to report-worthy scale.
What is wrench time, and why is it the key metric for construction productivity tracking?
Wrench time is the proportion of total on-site labor time that workers spend in direct productive activity - actually performing the assigned task rather than traveling, waiting, handling materials, or attending to administrative activities. It is the key metric because it directly measures the efficiency of labor deployment, independent of crew size or hours worked. A site can have excellent headcount adherence but poor wrench time, which means the workers are there but not working effectively. Wrench time analysis identifies where this gap exists and what category of non-productive activity is driving it.
How does AI detect productivity gaps that human observation misses on large sites?
AI identifies productivity gaps through pattern recognition at scale - analyzing thousands of data points across all crews, zones, and work packages simultaneously to find correlations and trends that no individual observer could track manually. The specific advantage is cross-dimensional pattern detection: AI can identify that a specific combination of conditions (a particular contractor, in a specific zone type, during a specific project phase) consistently correlates with efficiency below plan - a pattern that is invisible when you look at any one of those dimensions individually.
How should a project team respond to workforce analytics alerts to get the most value from the platform?
The critical success factor is alert ownership. Every alert category should be assigned to a named owner - typically the project manager for headcount variance alerts, the area superintendent for zone anomalies and efficiency declines, and the project controls lead for contractor delivery gap alerts. Each alert category should have a defined response timeline and a standard first-step action. Without this structure, alerts become a reporting artifact rather than a management tool. Platforms that include alert ownership and resolution tracking in their workflow design are more likely to drive action than those that generate dashboards without accountability structure.
What integrations does a construction workforce analytics platform need to be operationally useful?
The minimum necessary integrations for operational usefulness are: bidirectional connection with the site's access control system (for real-time headcount and gate-to-gate data), integration with the project schedule (for plan vs. actual comparisons at the work-package level), and connection with field productivity reporting tools (for the installed quantity data that gives labor hours their productivity context). Integrations with ERP and payroll systems add financial reporting value. Integrations with the owner's project management environment add owner relationship value. Start with the first three.
At what project scale does AI workforce analytics deliver measurable ROI?
The ROI threshold is lower than most project teams assume. On any project where the total labor cost exceeds a few million dollars, even a modest improvement in crew efficiency, 3 to 5 percentage points in wrench time ratio, produces labor cost savings that exceed the platform investment. The more directly measurable ROI mechanism is earlier detection of workforce gaps that would otherwise require costly schedule recovery: a subcontractor performance conversation supported by two weeks of data in week four is dramatically cheaper than an acceleration program negotiated in week twelve.
%20(1).svg)


