.svg)



The schedule conversation that project teams dread most is not the one where a single large problem forces a recovery plan. It is the one where the question is: how did we get three weeks behind with no obvious turning point? Because the honest answer; that small workforce gaps, productivity shortfalls, and sequencing deviations accumulated unnoticed over a period of weeks - is a harder conversation than an act of God or a supplier failure.
Complex construction projects are uniquely susceptible to this kind of slow-motion delay. High trade density, phased turnover, compressed schedules, and large contractor populations create an environment where the interactions between work packages are numerous and the tolerance for deviation is low.
A workforce shortfall in one area creates idle time for a following trade. A sequencing error in week four becomes a rework event in week six. By week eight, the schedule has absorbed enough compounding disruption that the recovery options are expensive.
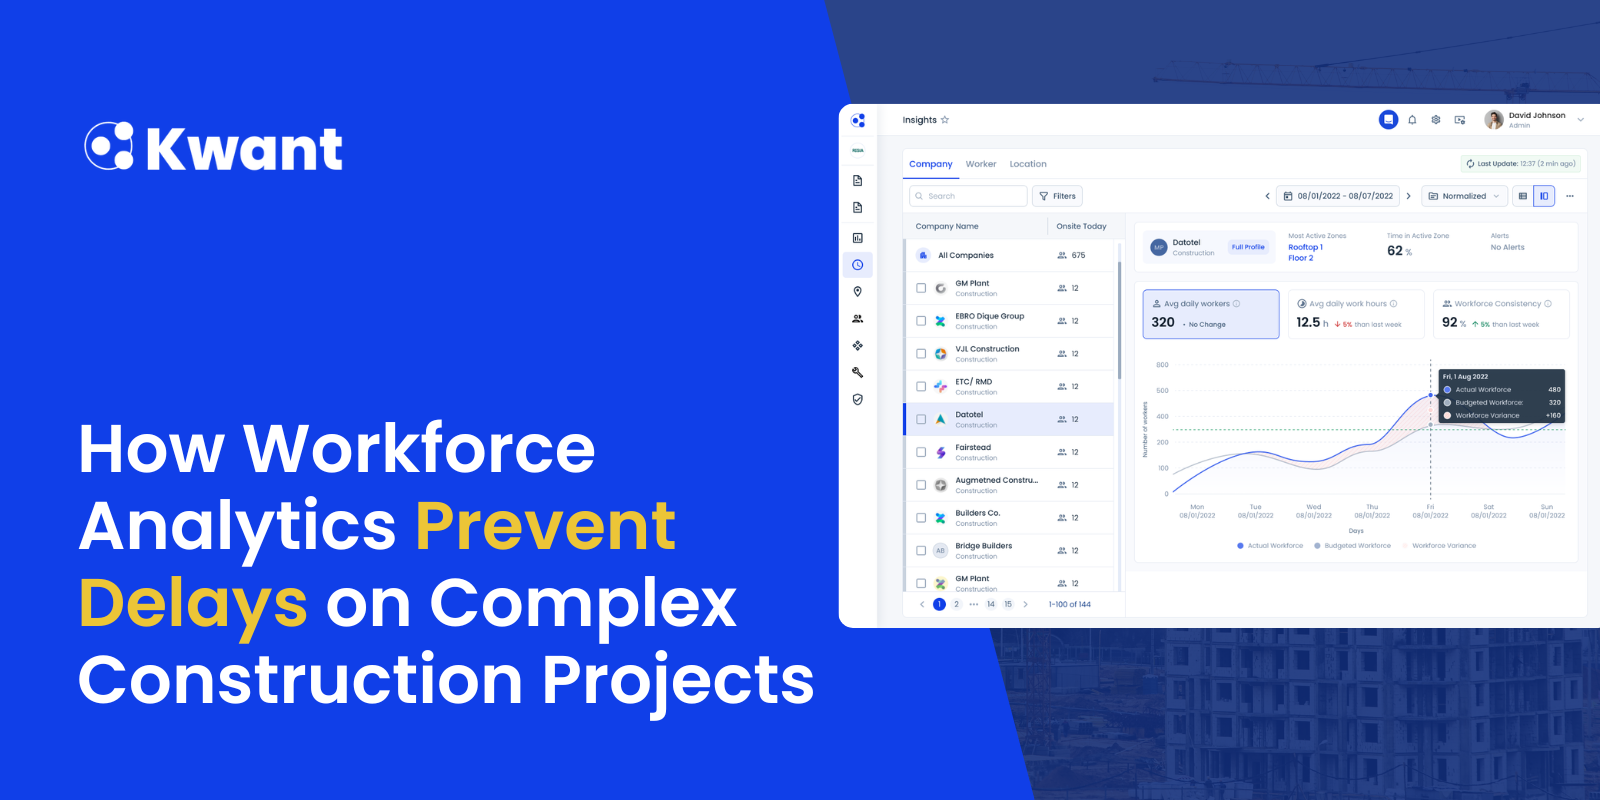
Workforce analytics prevent delays on complex construction projects by surfaces these warning signs as leading indicators; under-manning trends, zone density divergence, contractor delivery gaps, while schedule float still exists and intervention is still cheap.
The tragedy of these delays is not that they were unavoidable. It is that the data describing them was present the whole time. Workforce analytics exists to make that data visible and actionable while the schedule still has room to absorb a response.
Why Complex Projects Compound Workforce Delays Faster Than Simple Ones
A straightforward construction project has relatively few interdependencies. Work in one area doesn't block work in another until the project approaches completion. A workforce shortfall affects the work packages that crew is assigned to, and the impact propagates slowly.
High-complexity projects like data centers, semiconductor fabs, large healthcare builds, don't have this buffer. The interdependency density is high. Structural completion enables equipment setting, which enables process piping, which enables instrumentation, which enables commissioning. Each predecessor affects multiple successors. A workforce gap that delays a single predecessor activity creates a cascade of idle time and rework across the entire downstream sequence.
Data center builds add an additional dimension: phased turnover, where portions of the building are released to the owner for equipment installation and commissioning while construction continues in adjacent sections. The boundary between active construction and live operations has to be maintained with precision, and any schedule slippage that compresses the commissioning window creates direct financial exposure for the owner, who may have customer commitments tied to the go-live date.
In this environment, 'we noticed the problem and addressed it' is not a satisfying answer when the notification came from a weekly schedule update. The response window that existed when the problem was developing, before it affected the critical path, was the time to act. Workforce analytics is the mechanism for seeing that window.
The Difference Between Project Controls and Workforce Intelligence
Project controls in a conventional sense answers questions about schedule and cost: are activities completing on time, and are resources being consumed within budget? These are essential questions. They are also questions that are answered with data that is typically one to two weeks old by the time it reaches the project controls team in a usable format.
Workforce intelligence asks different, earlier questions: do we have the workers in the right places to stay on schedule over the next week? Are the crews currently deployed performing at the productivity rate the schedule assumed? Are the subcontractors delivering their committed headcount, and if not, which work packages are at risk?
The distinction is timing and specificity. Project controls tells you where the schedule stands. Workforce intelligence tells you whether the workforce conditions are in place to keep it there. On a complex project with high interdependency, the gap between those two information sets is where most preventable delays originate.
The Specific Warning Signs That Workforce Analytics Catches Early
The warning signs that precede most complex project delays are consistent enough to identify and track. The value of workforce analytics is that it tracks them continuously and systematically rather than depending on individual observers to notice them and escalate.
The most reliable early warning sign is the manpower plan gap. When actual crew size is consistently below the staffing plan for a critical path work package, the schedule is accumulating a deficit that will eventually appear as a schedule variance. The gap is visible in access control data the same day it occurs. On a project where it is only reviewed weekly, the same gap appears as a problem after five iterations of data have confirmed it.
The second consistent warning sign is contractor headcount delivery trending downward. A subcontractor who is delivering 97% of their committed crew in week two, 91% in week four, and 84% in week six is on a trend that will produce a serious shortfall in week ten. That trend is obvious in the data. It is frequently invisible in the weekly standup because each individual week's deviation seems manageable.
The third is zone density divergence from the area plan. When workforce concentration in a specific zone doesn't match the area plan, it means either that work is ahead of schedule there (which would be worth knowing) or that crews are displaced from their planned areas by a sequencing problem (which definitely needs to be known). Either way, the signal is actionable.
Kwant’s Construction Daily Report System for Real Time Jobsite Data
Predictive Workforce Analytics: Using Historical Patterns to Forecast Forward
After several weeks of consistent data collection on an active project, the analytics platform accumulates enough historical information to make forward-looking forecasts that go beyond simple plan vs. actual comparison.
Contractor-specific productivity factors covering the observed relationship between committed headcount and delivered productivity for each subcontractor on this project, become the most reliable inputs for forward schedule modeling. They are better than industry averages because they are specific to this contractor, on this project type, in the current labor market. A schedule model that uses contractor-specific productivity factors derived from the first eight weeks of a project is a substantially more reliable forecasting tool than one that uses the original bid assumptions throughout.
Exception-based alerts complete the predictive layer. Rather than requiring project managers to monitor trend charts continuously, the platform flags the specific conditions that its historical pattern analysis identifies as elevated risk: the combination of crew density below plan, declining productivity trend, and new subcontractor mobilization that historically precedes a sequencing problem. The manager doesn't need to see the pattern, the workforce analytics platform surfaces it.
How Owner-Facing Workforce Reporting Changes the Project Relationship
One of the least-discussed benefits of workforce analytics on complex projects is its effect on the owner relationship. Owners of data center campuses and other mission-critical projects have direct financial exposure tied to construction schedule performance. They have a legitimate interest in understanding whether the workforce conditions supporting the schedule are healthy, and they are asking that question more frequently and more specifically than they did a decade ago.
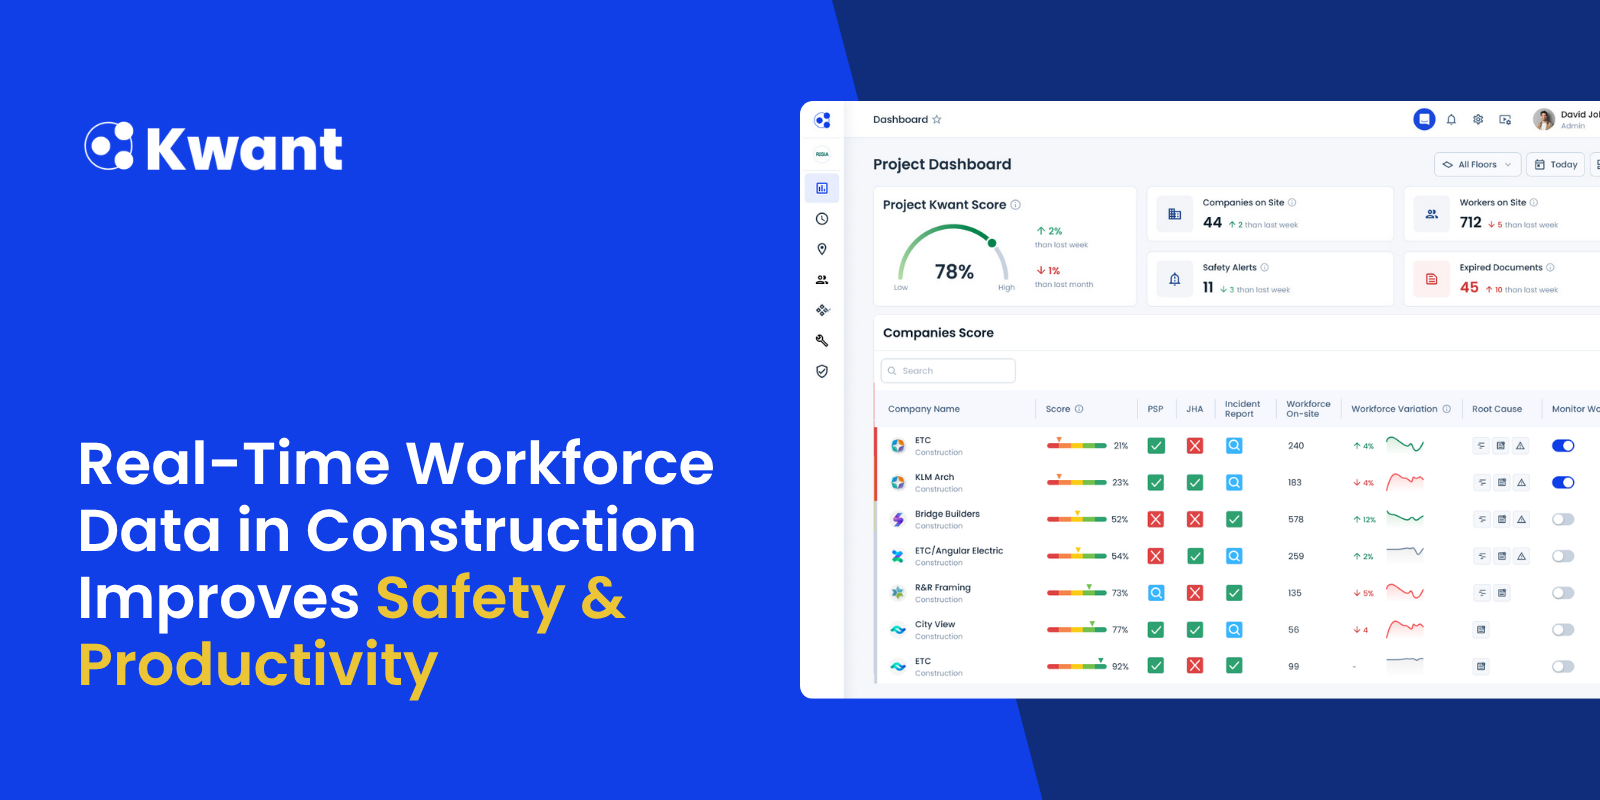
A GC who can provide daily headcount vs. plan by work package, contractor delivery trends, and a forward-looking workforce performance assessment is having a different quality of conversation with that owner than one who provides a weekly schedule update and narrative progress summary. The data-driven GC is demonstrating that they are actively managing the workforce, not just reporting on the schedule.
Kwant supports programs where this level of reporting is a baseline owner expectation. Where daily workforce performance data flows into owner-facing dashboards that provide real-time visibility into the conditions driving schedule performance. This is not a future capability. It is a current expectation on the most sophisticated capital programs.
What to Look for in a Workforce Analytics Platform for Complex Projects
- Work-package-level analytics, not just site-level summaries. Delays on complex projects happen at the work-package level. The analytics platform needs to show performance at that granularity. Not just total site headcount, but headcount by work package, compared against the staffing plan for that specific scope.
- Bidirectional integration with the CPM schedule. Workforce data is most valuable when it updates the schedule model in near real time. Replacing estimated productivity inputs with measured ones. Look for platforms that support bidirectional data flow with Primavera P6 or the project's scheduling environment.
- Contractor performance tracking at the commitment level. The analytics platform should maintain a record of each subcontractor's headcount delivery against their daily commitment, not just their absolute headcount. This distinction is important for subcontractor accountability conversations.
- Zone-level access data integration. Site-level headcount doesn't reveal sequencing problems. Zone-level workforce density, compared against the area plan, does. The platform needs access to zone-level access data to produce this analysis.
- Owner-facing reporting capability. If the platform can only be accessed by the GC's project team, its value in owner relationships is limited. Look for role-based access that allows owner representatives to pull their own reports directly.
Complex projects don't need to fail the way they currently do. The information required to prevent the compounding delays that characterize most complex project overruns is present in the workforce data that the site generates every day. The gap is not the data - it is the infrastructure to see it clearly and the organizational discipline to act on it quickly.
Workforce analytics is the infrastructure. The discipline is the harder part, and it has to come from the project leadership. But it is much easier to exercise that discipline when the signals are clear, timely, and specific - rather than filtered through a weekly reporting cycle that arrives after the response window has closed.
The teams that have built this capability are not doing it because it is interesting. They are doing it because the owners they work for are demanding better performance, and the project economics of complex builds don't allow for three-week recovery programs that could have been avoided with two weeks of visible data.
See how Kwant's workforce analytics platform supports schedule performance on complex construction projects. Request a demo at kwant.ai.
Frequently Asked Questions
How does workforce analytics prevent delays differently from traditional project controls?
Traditional project controls detects schedule variance after activities miss their planned completion dates - it is a measurement of outcomes. Workforce analytics detects the workforce conditions that precede those variances: under-manning, declining crew efficiency, contractor delivery gaps. The practical difference is timing. Workforce analytics surfaces these signals when they are leading indicators, while schedule float still exists. Project controls typically surfaces them after the schedule has already absorbed the impact.
What is predictive workforce analytics and how does it work in a construction context?
Predictive workforce analytics uses historical performance data from the current project to build forward-looking forecasts of workforce productivity and schedule risk. After several weeks of data collection, the platform develops contractor-specific productivity factors, crew delivery trends, and zone-level performance benchmarks that are more accurate inputs for schedule forecasting than the original bid assumptions. The platform then models the schedule implications of current performance trends and flags scenarios where those trends produce milestone risk, before the risk is confirmed by a missed date.
What workforce data inputs are needed to generate useful analytics on a complex project?
The minimum necessary inputs are: daily actual headcount by trade and contractor vs. the staffing plan, zone-level access data (which zones crews are in, and when), and field productivity reports that connect labor hours to specific work packages. These three inputs enable plan vs. actual comparison, zone density analysis, and work-package-level efficiency tracking. Additional inputs - wearable data, equipment utilization data, material delivery records - can extend the analysis but are not required for the core schedule risk detection function.
How does construction workforce intelligence integrate with Primavera P6?
The most effective integration between workforce analytics and P6 is bidirectional. The analytics platform receives the staffing plan from P6 - which crew sizes and trades are planned for each activity on each date - and uses it as the baseline for plan vs. actual comparison. The analytics platform sends actual performance data back to P6 - measured productivity rates, actual hours by activity - which updates the schedule model with real inputs rather than estimates. This keeps the CPM current with actual performance and makes the forward-looking schedule forecast more reliable.
What reporting should a data center GC provide to an owner on workforce performance?
At minimum, the reporting that sophisticated data center owners expect is: daily headcount by major trade category vs. plan, weekly contractor delivery performance against commitments, and a monthly trend analysis showing productivity index by work package. Forward-looking owners - those managing multiple concurrent data center builds - increasingly expect access to a workforce performance dashboard that provides real-time visibility rather than report-cycle summaries. GCs who provide this level of transparency are differentiating themselves in owner relationships in ways that influence future award decisions.
Can workforce analytics platforms handle the scale of a large data center campus with multiple concurrent structures?
Yes, but the platform architecture needs to support multi-structure, multi-zone data aggregation in a way that preserves work-package-level granularity rather than collapsing it into site-level summaries. Look for platforms that maintain separate data models per structure or per work package while providing a unified program-level dashboard. The ability to drill from program summary to structure-level to work-package-level to individual crew data should be seamless - requiring clicks, not data exports.
%20(1).svg)


