.svg)

.png)


Webinar
Custom Dashboards: Build Smarter Construction Workforce Reports
September 21, 2026
Get more from your construction workforce data with Custom Dashboards from Kwant.
Custom Dashboards make it easier for teams to organize and visualize the reports and data that matter most to their projects. Instead of searching through different reports, users can access multiple custom reports directly from their project dashboard.
Use Custom Dashboards to visualize information such as:
- Worker statistics
- Supervisor-to-worker ratios
- Zone-based workforce breakdowns
- Muster point and evacuation reports- Device and equipment tracking
- Safety logs
- Schedule data
- Other customer-specific datasets
Custom Dashboards can also connect workforce data with jobsite visibility. For example, users can select a worker's last seen location and jump directly into ZoneIQ to see where that worker was last detected.
This can be especially valuable during emergency situations. If workers are missing from a muster point, safety teams can quickly locate their last known position and send an alert directly from the location view, including photos or other media with instructions.
These improvements make construction workforce data easier to access, visualize, and act on, while giving teams more flexibility to build dashboards around their specific workflows.
Watch Jayesh and John Kalajian discuss how Custom Dashboards and improved workforce visibility are helping construction teams get more value from their data.


You may also like
.png)
What’s Next for Kwant: AI, Smart Sensors & Construction Technology


.png)
Onboarding 2.0: A Smarter, More Flexible Worker Onboarding Experience
.png)
Bob, the AI Assistant Gets Smarter: Create, Edit & Schedule Reports
.png)
.png)
Custom Dashboards: Build Smarter Construction Workforce Reports
.png)
Mass SMS Alerts: Send Photos, Videos & Audio to Jobsite Crews
.png)
.png)
.png)
Meet Bob, the AI Assistant for Construction Workforce Intelligence
.png)
Kwant Mobile App | Worker Check-Ins, Safety Flags & Offline Access
.png)
.png)
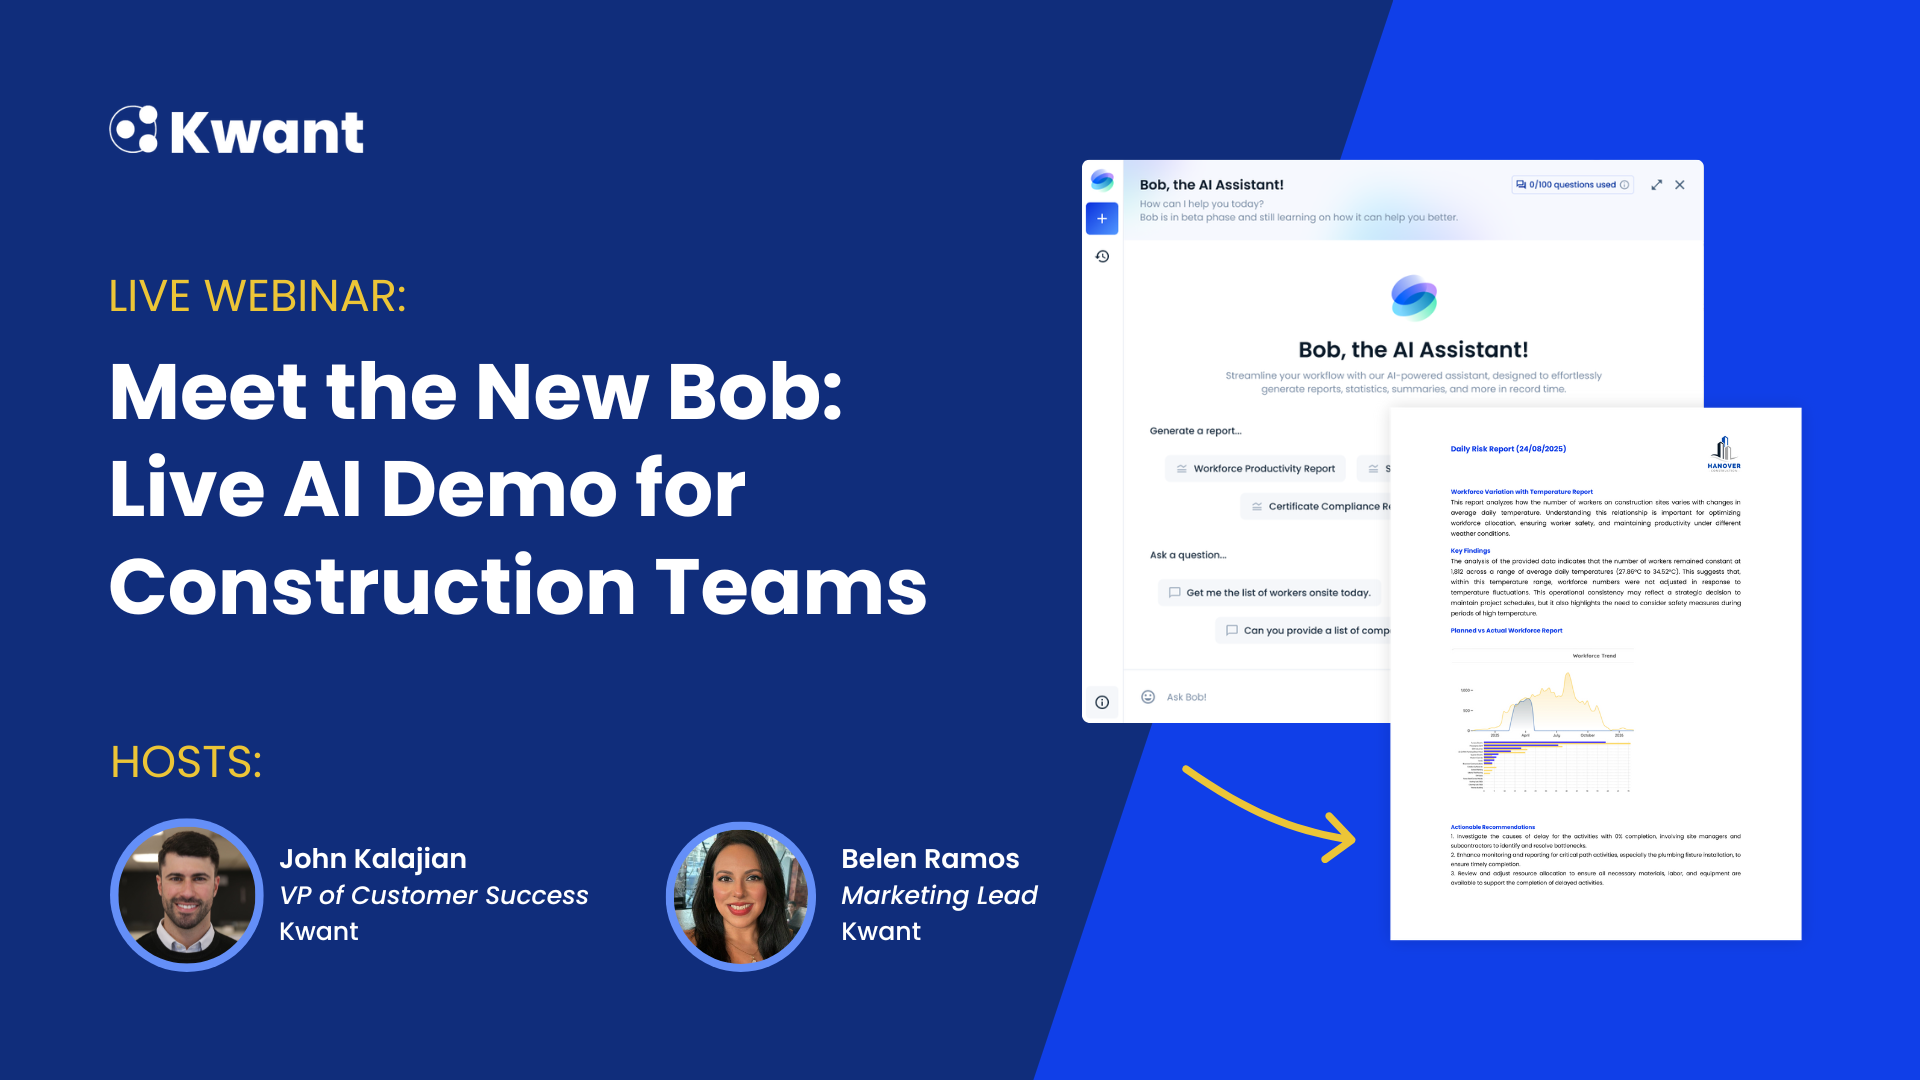

Meet Bob: Your AI-powered CoPilot for Smarter Workforce Management

.webp)
Driving project management leadership, safety, and women in construction

Bits to Atoms Series #1: Bridging the Gap Between Lagging & Predictive Analytics in Construction

Bits to Atoms Series #2: Unlocking Data-Driven Insights & Analytics for Industrial Project Safety & Productivity
.webp)

Bits to Atoms Series #3: Leaders Eat Last Safeguard the Craft Workers
%20(1).svg)


